 Gloriously Awkward Life
Last night on Batuu East.

Last night on Batuu East.
This evening on Batuu East with Star Wars Galaxy’s Edge Discord to celebrate Batuu East’s 6th anniversary (on August 29th).
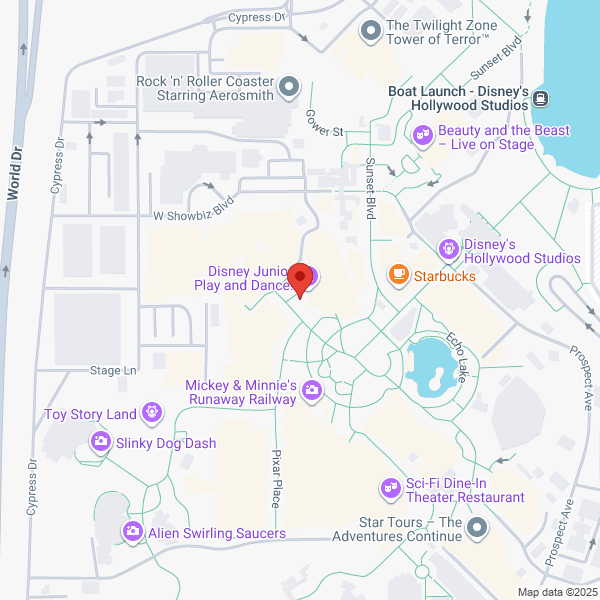
Setting up my LED backpack for a meetup tonight in Galaxy’s Edge at Disney’s Hollywood Studios…
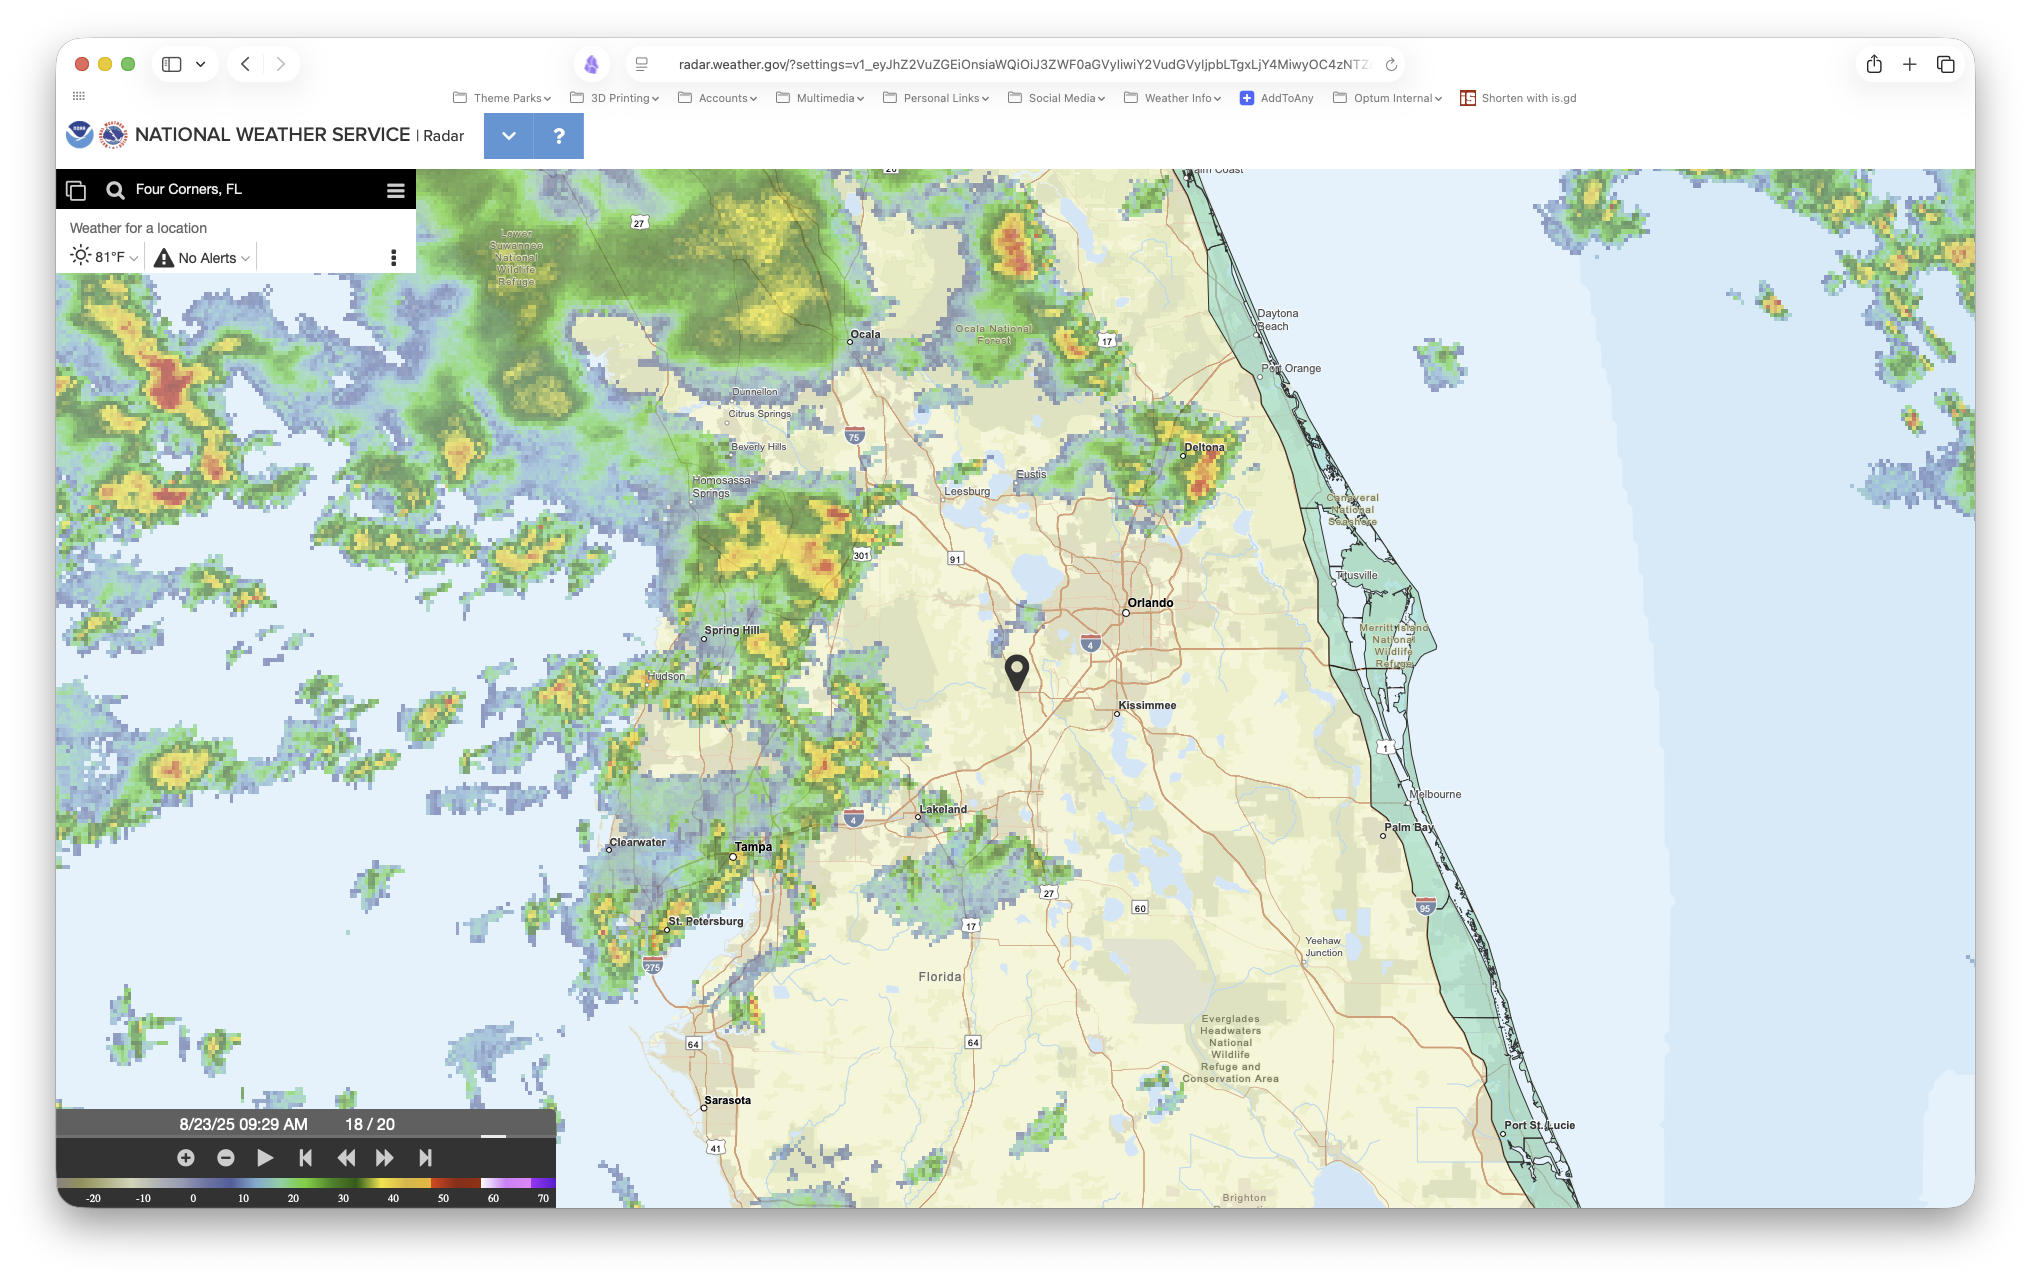
So yeah. Wet morning incoming ⛈️ another summer day in Florida. Should clear out before tonight’s meetup on Batuu East (Lightsaber Meetup at Disney’s Hollywood Studios tonight starting at 9:15 PM in Galaxy’s Edge).
Python script to parse the export file from Apple Health and plot a heart rate chart.
<img src=“https://cdn.uploads.micro.blog/249986/2025/7ea58cf0fd.png" width=“562” height=“495” alt=“Auto-generated description: A heart rate plot from an Apple Watch shows data points between May and August 2015, with blue dots indicating heartbeats per minute on a local timestamp, and highlighted green and yellow bands.”>
import pandas as pd, matplotlib.pyplot as plt
age=53
df = pd.read_xml(
    "/Users/steven/Downloads/apple_health_export/export.xml",
    xpath="//Record[@type='HKQuantityTypeIdentifierHeartRate']",
    parse_dates=['creationDate','startDate','endDate']
)
plt.rcParams.update({
    'font.family': 'PT Sans',
    'timezone': 'America/New_York'
})
chart=df.plot(
    title='Heart Rate Plot (Apple Watch)',
    x='endDate',
    y='value',
    xlabel='timestamp (Local)',
    ylabel='bpm',
    kind='scatter',
    rot=90,
    fontsize=8,
    s=0.5,
    xlim=(pd.Timestamp('2025-05-24T00:00:00-04:00'),pd.Timestamp('2025-08-20T00:00:00-04:00'))
)
plt.axhspan(ymin=(220-age)*0.50,ymax=(220-age)*0.70,color=('g',0.25)) # Moderate effort target zone (50-70%)
plt.axhspan(ymin=(220-age)*0.70,ymax=(220-age)*0.85,color=('y',0.25)) # Strenuous effort target zone (70-85%)
plt.axhline(y=(220-age),color='r',linestyle=':')                      # Age-predicted max heart rate (220-age)
Current 24/7 earworm:
Long way to go if I intend to catch up with @manton.


