Creating Charts from Apple Health data using Python/Pandas
It is possible to export the data from Apple Health by tapping on your image in the upper right corner of the screen and then scrolling down to tap “Export All Health Data”. It’ll then prompt where to save it, which it does as export.zip.
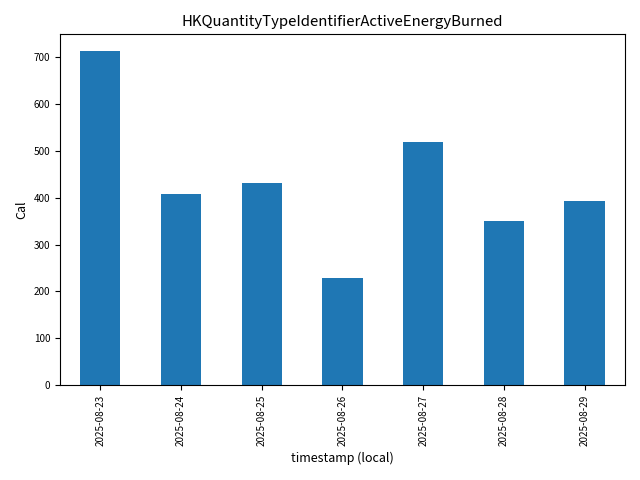
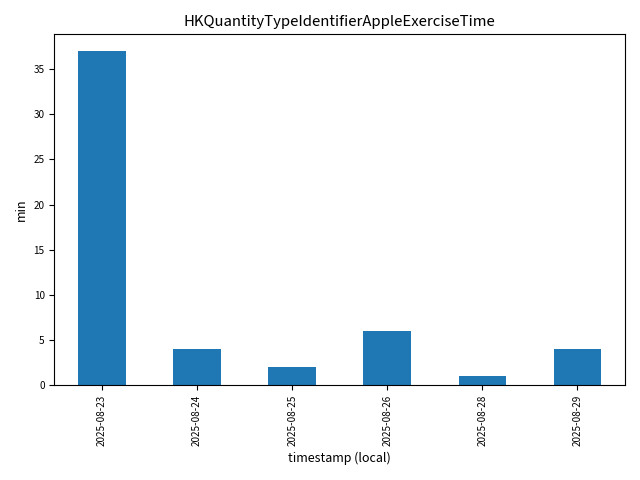
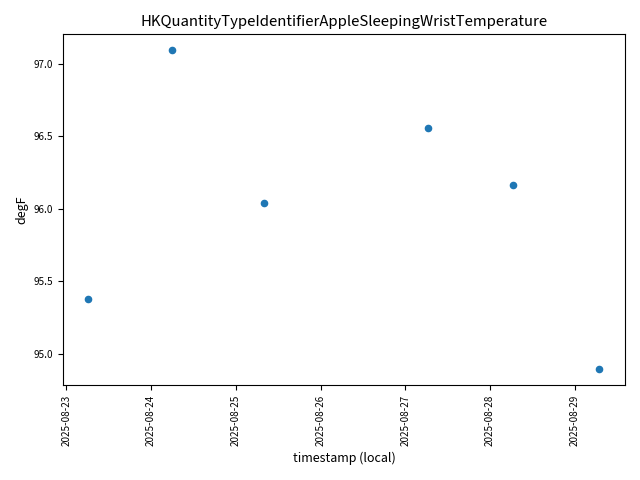
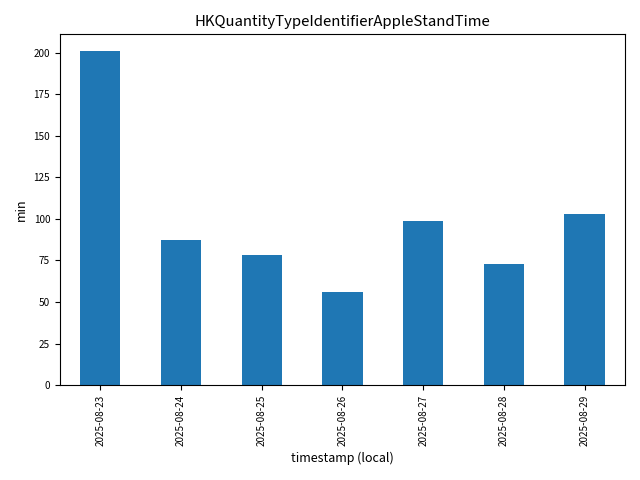
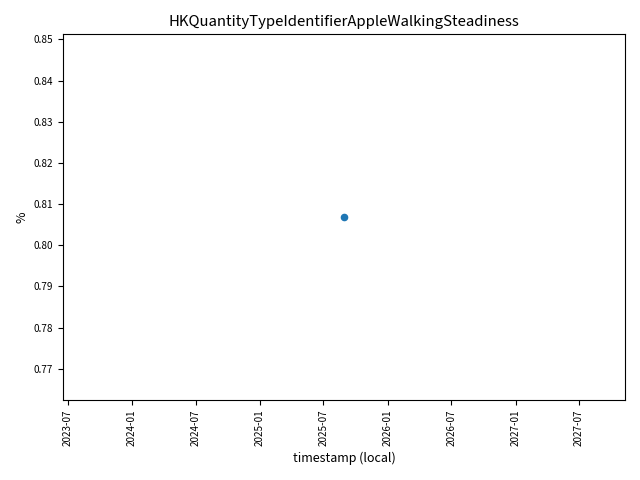
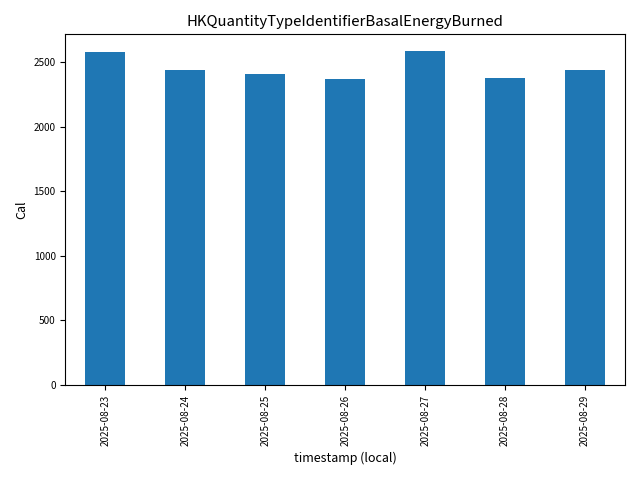
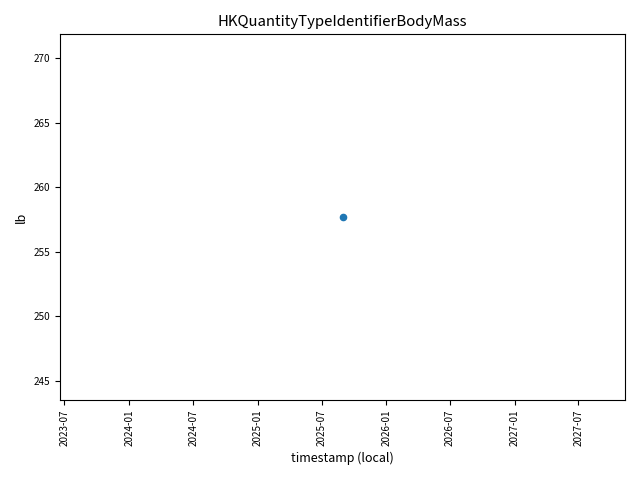
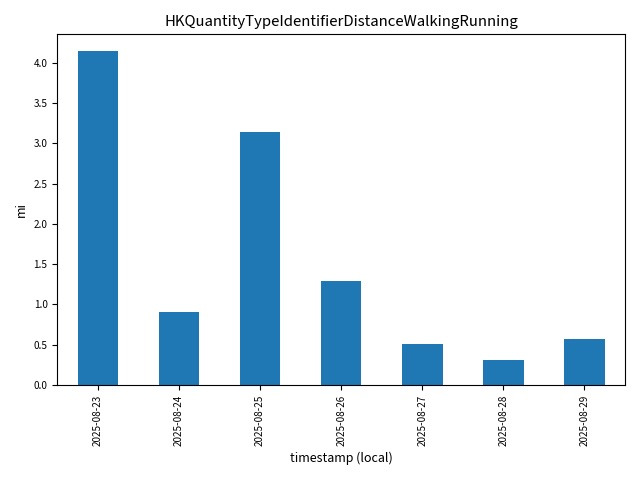
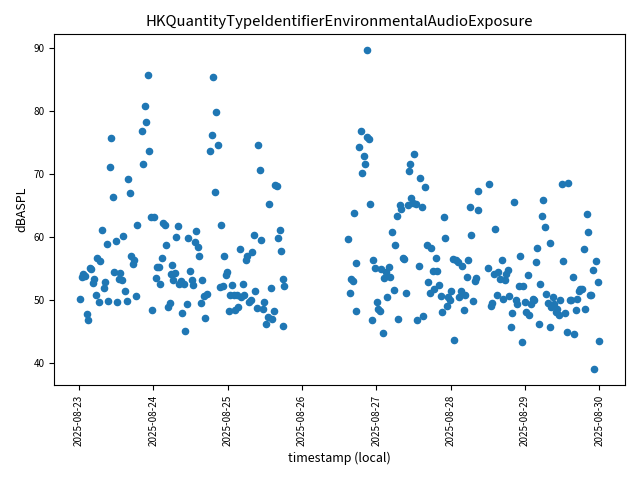
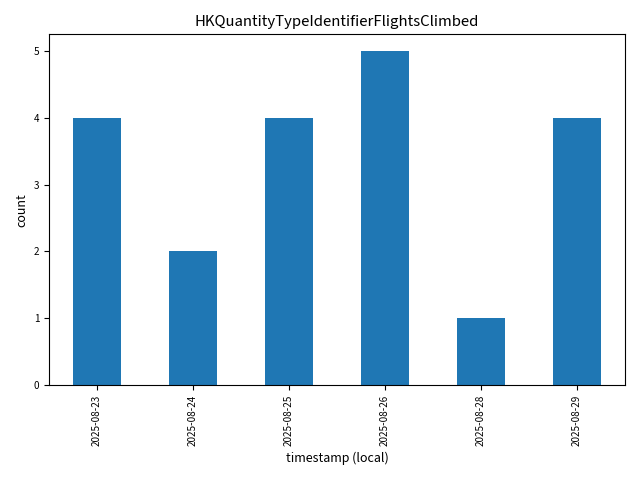
The following Python 3.x script will take that .zip file and create charts for the last seven days (adjustable in the script). Where it makes sense to create a total daily number instead of individual data points, I set up those metric names to do so.
You’ll want to update the time zone under plt.rcParams.update() if needed; I used U.S. Eastern Time (otherwise it will default to UTC).
import pandas as pd, matplotlib.pyplot as plt, zipfile
from datetime import datetime, timedelta, time

age = 53 # used for heart rate ranges
startDate = (datetime.combine(datetime.now().date(),time.min) - timedelta(days=7)).isoformat()
endDate = datetime.combine(datetime.now().date(),time.min).isoformat()
zf = zipfile.ZipFile("export.zip", "r")
df = pd.read_xml(
    zf.open("apple_health_export/export.xml"),
    xpath="//Record[contains(@type, 'Quantity')]",
    parse_dates=["creationDate", "startDate", "endDate"],
)
plt.rcParams.update({"font.family": "Source Sans 3", "timezone": "America/New_York"})
for t in sorted(df["type"].unique()):
    if df[(df["type"] == t) & (df["endDate"] >= startDate) & (df["endDate"] < endDate)].shape[0] > 0:
        if (t in [
            "HKQuantityTypeIdentifierActiveEnergyBurned",
            "HKQuantityTypeIdentifierAppleExerciseTime",
            "HKQuantityTypeIdentifierAppleStandTime",
            "HKQuantityTypeIdentifierBasalEnergyBurned",
            "HKQuantityTypeIdentifierDistanceWalkingRunning",
            "HKQuantityTypeIdentifierFlightsClimbed",
            "HKQuantityTypeIdentifierStepCount",
            "HKQuantityTypeIdentifierTimeInDaylight"
        ]) or ("Dietary" in t):
            unit = df[(df["type"]==t)].iloc[0].unit
            df2 = df[(df["type"] == t) & (df["endDate"] >= startDate) & (df["endDate"] < endDate)].groupby(df['endDate'].dt.date)['value'].sum()
            kind="bar"
        else:
            unit = df[(df["type"]==t)].iloc[0].unit
            df2 = df[(df["type"] == t) & (df["endDate"] >= startDate) & (df["endDate"] < endDate)]
            kind="scatter"
        chart = df2.plot(
            title=t,
            x="endDate",
            y="value",
            xlabel="timestamp (local)",
            ylabel=unit,
            kind=kind,
            rot=90,
            fontsize=8
            )
        plt.tight_layout()
        plt.savefig(f"{t}.png", format="png")
        plt.close()
